County scientist explains changing face of Lake Ontario
Administrator | Dec 01, 2020 | Comments 0
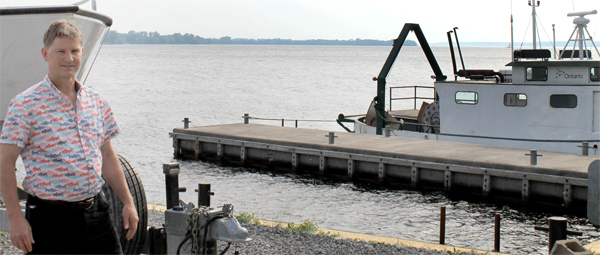
Dr. Tim Johnson, of Picton, spoke to Prince Edward County Field Naturalists about changes in Lake Ontario.
By Sharon Harrison
‘Most people’s connections to the Great Lakes end at their knees’, said Dr. Tim Johnson, of the Glenora Fisheries Station. But there is much happening in the water that in turn, affects health of all organisms that live in and around it.
With their regular monthly meetings moved to a virtual format, the Prince Edward County Field Naturalists continue to host special guests, and this month welcomed Johnson, a senior research scientist with the Ontario Ministry of Natural Resources and Forestry based at the Glenora Fisheries Station.
Tim Johnson
Johnson is well-known as ‘The Fish Guy’ who led elementary students in the County through Atlantic Salmon hatchery learning programs for more than a decade. His job, however, is to provide science advice and support to fishery management on issues such as invasive species, climate change, habitat loss and contaminants.
“Tim’s research focus is the structure and efficiency of aquatic food webs, including the effects of aquatic invasive species, climate change, and habitat alteration on growth and production of fishes and other aquatic organisms,” stated Amy Bodman, PECFNs vice-president.
Tuesday evening’s meeting, the third of its kind in the new virtual format, was open to members of the public as well as PECFN members, and attracted around 30 participants.
The in-depth and technical presentation focused on the changing face of the Great Lakes with specific focus on Lake Ontario, but also explained patterns and trends and what scientists are learning about the lake’s behaviour. Johnson provided observations, evidence the lakes are getting warmer, and a revelation about zebra mussels.
“I have lived in the County now for 17 years, my wife and I have raised our two daughters who are now at university and just wrapping-up at PECI,” said Johnson.
Johnson was recognized with the Jack Christie/Ken Loftus Award this year, something he said was a great honour.
“Jack Christie was the first Great Lakes scientist working at the Glenora Fisheries Station and had a very productive and illustrious career, and his namesake lives on through that award and it was a great honour for me.”
Johnson began by noting the massive body of Lake Ontario is 19,000 square kilometres in size – about three or four times the size of Prince Edward Island. The Great Lakes basin represents the world’s largest contiguous freshwater ecosystem.
“Most people’s connections to the Great Lakes, as big and as amazing as these systems are, end at their knees, that is about as far most people will actually get into the Great Lakes,” he said, adding, there is so much more happening below the surface.
“It affects human health and the health of all of the organisms, terrestrial, aquatic and avian that live in and around it, so understanding the state of the lakes and the concerns regarding their overall well-being is critical to understanding our own health and well-being as well,” he said.
Johnson says working with ecological numerical models is one way to thoroughly address problems, and either prevent them from reoccurring or find mitigations and adaptations that allow them to improve.
“We develop a way of understanding everything from the drivers of the system, things like physical impacts or human impacts, all the way down to the things that we go out and observe and measure; and we can come up with a good understanding of the inter-relationship between all the components in the ecosystem.”
When referring to ecological change, different dimensions are considered, such as physical change, for example ice cover, something he noted was considered volatile.
“Over the last 50 years, we can see that there were years when we had virtually no ice on Lake Ontario (such as in 2012), and years when we had considerable ice cover on Lake Ontario, as much as 90 per cent coverage.”
Overall, he noted the trend indicates a significant reduction, on average, in the amount of ice on Lake Ontario.
“This could be inferred as a reflection of climate change or other things, but we basically in 50 years have cut the amount of time in half, from around 40 to down to around 20.”
Johnson spoke to other changes, such as chemical change, and specifically PCBs (polychlorinated biphenyls) in lake trout, noting the trend was consistently declining, which was good news.
“There is less PCB in lake trout now than there was historically.”
He noted the Great Lakes Water Quality Agreement, a bi-national agreed-upon target, has not been met with regard to lake trout.
“We have made great progress, but we have not met our target yet.”
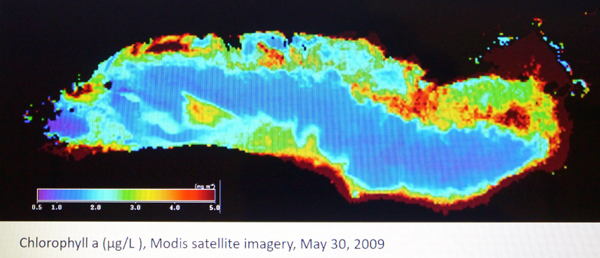 Moving to chlorophyll, the primary pigment in plant matter, Johnson showed a slide reflecting the density of chlorophyll in Lake Ontario, these are the tiny plants in Lake Ontario called phytoplankton.
“There is a tremendous amount of variability,” he said, noting high levels in near shore areas, with exceptions such Toronto and Hamilton that see very low levels of chlorophyll.
“Generally speaking, there is a gradient from near shore to offshore with the middle of the lake having very low levels of chlorophyll.”
Johnson highlighted the different species of fish caught in Lake Ontario from as early as the First World War, to present day.
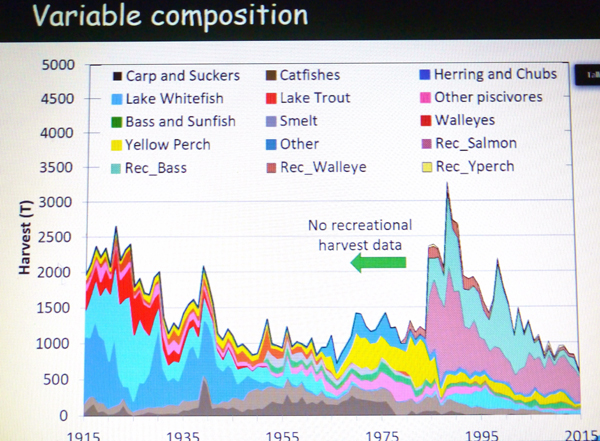 The data shows there are fewer fish in Lake Ontario, which is bad news. However, Johnson noted there is no longer a significant commercial fishery now as was the case through the years in the first, and second world wars.
“The demographics, the drivers of the system change through time,” he said. “Also, when we look at the composition, historically, the early part of the century, we were harvesting primarily lake white fish and herring, some lake trout. By the middle of the century, we had many more what we consider now to be coarse fish, things like carps and suckers and catfish, then in the late 70s and 80s we were taking a lot of yellow perch and other species such as northern pike, so larger predatory species.
“Generally, we saw changes through time, but also we can add the recreational harvest data and we get somewhat of a totally different interpretation historically. “
Discussing the history of fish populations, in 1990, more fish were being taken out of the system than a hundred years ago.
“The overall driver says the overall harvest is declining, but the composition of the catch is driven largely by salmonid species, these are the offshore Chinook, coho, rainbow trout, largely stock species put in the system to try to recreate recreational fishing opportunities,” he said.
“We do have the basses here which is the native species and then we’ve got walleye which is largely in the near shore areas,” explains Johnson. “When we look through time our context changes, because the composition of both our sampling methods, but also what’s actually out in the system responds to things like habitat loss, invasive species as well as human pressures, like pollution or exploitation.”
Johnson showed the comparison of all the Great Lakes relative to food web indicators.
He said the different food web indicators include tiny plants, phytoplankton (at the base of the food web), the zooplankton (the smallest animals), the benthos (little bottom dwelling snails, worms) moving up to a variety of organisms of small fish and larger fish, and then onto fish-eating water birds.
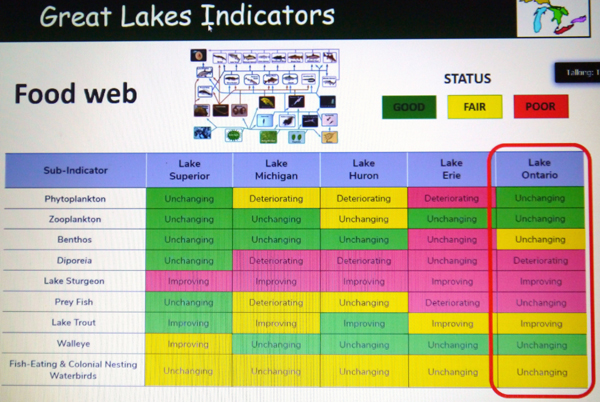 Lake Ontario is doing better than Lake Erie for certain metrics, but worse than Lake Huron or Lake Michigan other. Overall, he said, Lake Ontario is doing reasonable well.
Johnson said a lot of trends are unchanging, some are improving, and in the case of diporeia (a small bottom dwelling organism), things are deteriorating.
“Overall, when we step back and take this 10,000-foot elevation look at the lake, things certainly have room for improvement, but at least the trends are not deteriorating: many are unchanging, a few are improving, so there is progress being made and hope.”
He spoke to cumulative stresses affecting the Great Lakes which includes invasive species, land use, draining of wetlands, fishery exploitation and commercial navigation.
“Lake Ontario has the highest stress index of any of the Great Lakes. When we think about its resilience and its ability to withstand stressors or pressures, and when we think about how quickly it will respond, Lake Ontario has really got a tough grind ahead of it.”
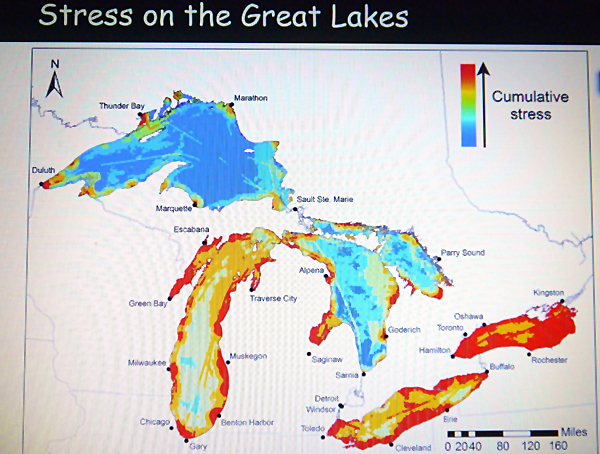 Some, he said, is due the natural geography, explaining how “the problems of Lake Superior become Lake Huron’s problems, which become Lake Erie’s problems and eventually everybody else’s problems become our problems.”
Discussing key metrics of what’s changing in Lake Ontario and why, he looked at relationships between some of the stressors, response variables and management actions used to mitigate.
“The Great Lakes food web basically consists of algae, phytoplankton at the base of the food web, small animals called zooplankton, these are all microscopic, we’ve got benthos, classic things like the dreissenid mussels (zebra and quagga mussels), little worms and snails, small fishes (prey fishes), but they are ecological members, they aren’t just out there to be eaten, but we do have a very abundant and economically and ecologically important group of predators consisting of native species, then we’ve got predators, parasites (sea lamprey), various water birds and so forth.”
Johnson also talked about phosphorous, a nutrient that fertilizes the primary component of many of the fertilizers that are used on lawns and gardens.
“In lake systems, phosphorous tends to be the limiting nutrient, largely comes from terrestrial sources, and this is the trend line for Lake Ontario from the 1970s up to about 2015.”
He noted the amount of phosphorous declined dramatically down to levels now that are about a third of what they used to be.
“In the 70s, the excessive amounts of phosphorous were creating significant problems for the water quality and the ecosystem and they needed to get it managed and they did through secondary sewage treatment, land use, best management practices for agriculture and reducing sewage introductions into the lakes,” explained Johnson. “And we met that goal by the mid-1980s, but that trend continued to go down.
“The general trend for all of the lakes is that there has been a decline through time except for Lake Erie,” he said. “We are at or well below the targets that were established in the early 1970s (and revisited in the mid-1980s) and now we are coming back and just asking ourselves, we are so far below these targets in so many of these lakes, do we need to revisit that and rethink the phosphorus, because that fertilizer is really what’s driving the base of the food web.”
Clarity of the water is measured using a secchi disk, an eight-inch wheel lowered into a water column.
“When we can’t see it anymore, that’s the depth of the water,” he said. “It can be used in any system by anybody anywhere, but it’s a wonderful simple tool to allow us to understand water clarity.”
In the Great Lakes generally, water clarity used to be two or three metres (about 10-feet), but is now measuring at six or eight metres (20-25 feet).
“The water has become much clearer and that change started to happen about 1990 and that’s about when zebra and quagga mussels became established.”
He said while most people think of zebra mussels as a nasty invader that changed the system, their cousin, the quagga mussels has displaced them.
“In a very non-scientific way, zebra mussels are on the endangered list in Lake Ontario and it’s very difficult for us to find zebra mussels.”
“Quagga mussels are actually a more efficient invader: they can grow better at lower food concentrations and under harsher conditions, so while the zebra is what brought a lot of attention with ballast water and invasive species in the Great Lakes, their cousin is the current nemesis that we are dealing with.”
Johnson noted how dreissenid zebra and quagga mussels are largely related to the improvement in water clarify as well as reduction in nutrients.
“As the lake has changed, the water has been clearer, the light can penetrate to a greater depth, and now most of the chlorophyll, and most of the production of the algae, is now occurring below the thermocline, below the epilimnion.”
“When we look at the more recent data, we are starting to see a convergence that all of the lakes are starting to become more similar. Lake Superior hasn’t moved much; Lake Huron and Lake Michigan are starting to move towards Lake Superior, but Lake Ontario also has moved up, so that they are becoming more similar and so we are thinking that an entire Great Lake, 19,000 square kilometres of Lake Ontario, the whole community of animals, the base of the food web is changing to represent something fundamentally and therefore functionally different to what it was.”
Johnson noted that diporeia are declining rapidly and are now scarce.
“The most recent lake-wide survey in 2018, we caught two diporeia, two animals in the entire lake, that is a huge amount of sampling,” said Johnson. “We used to get thousands of them per square metre and now we found two of the animals, they are virtually extinct.”
“Back in the ‘90s when the dreissenid mussels came in, it was zebra mussels now it is predominantly all quagga mussels, but again correlation doesn’t necessarily equal causation, and a number of scientists have tried to investigate a functional relationship between these.”
Johnson noted diporeia was a critical food element with essential nutrients and when it disappeared the dreissenids and other organisms did not replace them, so nutritionally the whole food web has changed with the loss of diporeia.
He said, in the off shore, dreissenids have had largely negative effects on the food web, whereas in the near shore, there tends to be positive effects in terms of biomass.
“A surprise maybe to everybody is that Lake Ontario has the lowest diversity of the prey fishes of any of the Great Lakes (Lake Superior has the highest diversity) and some of that is largely because of a native fish community so the proportion of native species is 90 per cent with more of the Lake Superior fish are native, whereas only a few percent of the biomass of the prey fish in Lake Ontario is native.”
Lake Ontario is dominated by invasive species that have now established themselves in the system, said Johnson.
“As the prey community changes, so does the predators response to that.”
The Prince Edward County Field Naturalists’ next meeting is Tuesday, Jan. 26 at 7pm, via the Zoom internet application. All are welcome to hear Les Stanfield talk about the history and natural heritage of the South Shore. Details can be found at naturestuff.net.
Filed Under: Featured Articles
About the Author:


